Objective
Collaborate with the U.S. Environmental Protection Agency (EPA) to help decision-makers assess, prepare for, and respond to extreme event-induced contaminant releases to protect human health.
Approach
Develop an actionable screening indicators approach to assess the indirect impacts of extreme events on communities through potential exposure to releases from nearby contaminated sites and waste management facilities.
Impact
Creation of a conceptual framework and 58 new geospatial indicators—compiled into a free, downloadable handbook—that can be adapted globally to build climate resilience and protect communities from extreme event-induced contaminant releases. Local, state, regional, and federal decision-makers are applying the indicators to prioritize actions and target resources toward areas that may be impacted the most.
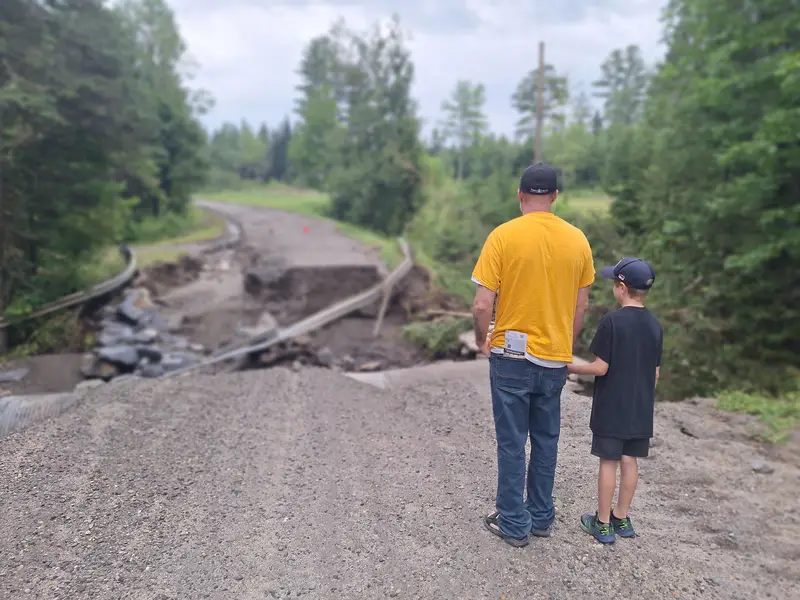
Worldwide, communities are facing adverse impacts caused by worsening extreme events. Although there is burgeoning literature on the direct impacts of extreme events on human health and well-being, impacts through the built environment and the surrounding landscape are understudied. One aspect of the built environment that may be impacted by more frequent and intense extreme events is contaminated sites and waste management facilities (“sites/waste facilities”). Contaminants may be released because of extreme events and are then transported via air and water to downstream or downwind communities. Contaminated sites and waste management facilities are frequently located near densely populated, under-resourced communities that already suffer from a combination of economic, health, social, and environmental burdens. Such communities could experience disproportionately higher impacts from contaminant releases caused by worsening extreme events.
How Screening Indicators Support Decision-Making
To address this growing concern, RTI International collaborated with the EPA’s Office of Research and Development to develop screening indicators that can help identify the sources of vulnerability and communities that may be impacted most by worsening floods, extreme heat, drought, and wildfires. These indicators can assist decision-making in the following ways:
- Increase awareness and tracking of sites/waste facilities that may be impacted by extreme events
- Prioritize resources and actions for preparedness, response, recovery, and adaptation planning
- Assess financial impacts of climate change for contaminated sites/waste facilities
- Develop communications for hazard mitigation, post-event response, and recovery
Taking a New Participatory Indicators Approach to Screen for Community Vulnerabilities
In 2016, we began developing a creative indicators approach that focused specifically on sites/waste facilities’ vulnerabilities to extreme events and their impacts on communities. Although the probability and potential impacts of such events can be simulated using refined modeling techniques and site-specific information, communities may face resource and time constraints in implementing such methods. We instead sought to develop a screening indicators approach that can provide actionable information needed for managing resources effectively to prepare for and respond to extreme climate events.
Addressing Gaps in Climate and Community Vulnerability Assessments
Our review of the scientific literature found many indicators that look at climate impacts on human health, agriculture, and other areas. However, comprehensive indicators based on a consistent framework that traces the pathway between the extreme events and communities were lacking. Engaging with local and regional planners, government officials, and community members revealed a need for such an approach, especially where environmental equity is of concern. To address this need, we developed a pioneering indicator approach that considers four sources of vulnerabilities—changing climates, contaminated sites/waste facilities, fate and transport, and population sensitivities—within a consistent framework (Figure 1). We compiled our findings into a free handbook to ensure local communities and planners have access. To develop and demonstrate our indicators method, we conducted two case studies (Maricopa County, AZ, and Waterbury, CT).
Information needs for decision-making vary depending on specific context and location. Early and sustained engagements with partners are crucial to ensure that indicators developed are suitable for unique local needs. Using a four-step participatory design (Figure 2), we worked with our partners to understand their concerns and developed a geospatial indicators approach that were responsive to their needs. A multidisciplinary workgroup including the U.S. EPA Office of Research and Development, U.S. EPA Office of Land and Emergency Management, U.S. EPA Region 1, U.S. EPA Region 9, Arizona Department of Environmental Quality, and the City of Phoenix was assembled, in addition to environmental economists, urban planners, GIS analysts, environmental scientists and engineers, and database specialists from RTI International.
Developing a Transparent and Replicable Indicators Framework
We developed a conceptual framework to identify and provide a shared understanding of key vulnerabilities and pathways that transcend disciplines. We leveraged RTI’s environmental, health, and economic modeling expertise to glean learnings that could translate key vulnerabilities into indicators and identify appropriate datasets. To ensure that the method is transparent and replicable, we used publicly available datasets from government or peer-reviewed sources. As illustrated in Figure 2, a sustained engagement process informed decisions at every step to ensure that results were locally relevant and clearly communicated.
A Holistic Framework for Assessing Community Vulnerabilities to Extreme Events
When assessing the vulnerability of communities, it is crucial to consider the interplay of climate change, contaminated sites/waste facilities, fate and transport, and disadvantaged communities. Our geospatial indicators represent each of these four vulnerability factors shown in the framework and includes the following:
- Historical and projected extreme events
- Characteristics of site/waste facilities such as quantity and nature of waste, remediation technologies that could be vulnerable to extreme events
- Topography, wind and hydrological patterns of the surrounding area (rather than simple radial distances) that could influence the movement of contaminants
- Sensitivity (e.g., socioeconomic, demographic) characteristics of the communities in the contaminant transport path
Figure 3 shows examples of questions our indicators can help answer in a flooding context. Only by considering all these interrelated factors can communities truly understand the nature and extent of potential impacts from extreme events and determine how best to protect themselves.
Real-World Applications and Impacts of the Indicators Approach
Our indicators approach can be applied for decision-making at different scales and for different contexts. The first two case studies were at the county and city levels.
Addressing Urban Flooding Risks in Waterbury, Connecticut
In Waterbury, Connecticut, flooding is a growing urban concern, particularly in areas where waste facilities are on rivers. We found that floodplain data, which are commonly used for potential inundation information across a given area, did not reflect changing climate scenarios. To address these issues, we developed a precipitation-based indicator that can be used in conjunction with an indicator showing low-lying areas to understand which communities may potentially be exposed to flooding and identify priority areas for actions or more in-depth modeling. Our indicators also provide information on which facilities potentially contain waste that could react with water and can be used to prioritize monitoring. The results also show a high percentage of households without private vehicles in areas close to sites/waste facilities. Some of these areas are low-lying with high projected increases in precipitation. This information can together aid emergency response and evacuation plans.
Tackling Extreme Heat Vulnerabilities in Phoenix, Arizona
Our work in Maricopa County, Arizona, looked at extreme heat in Phoenix, a rapidly growing city that recently set a record with 100 days of 100°F temperatures. By mapping indicators related to extreme heat, contaminated sites/waste facilities, contaminant transport via wind, and population characteristics, this study helped decision-makers in Phoenix and Maricopa County build their communities’ capacity to prepare for extreme events. The extreme heat indicators and maps developed for this Phoenix case study have been used to in the 2021 Phoenix Climate Action Plan. The site/waste facility indicators may be useful when considering proposed redevelopment opportunities. Our partners plan to share the fate and transport indicators with emergency responders and the Office of Homeland Security in the future. These indicators include response times and can inform where emergency response resources can be prioritized. The sensitivity indicators have previously been used for community engagement and to inform city leadership. More specifically, the percentage of households that rent was useful to the city to improve renters' access to programs (e.g., City of Phoenix's Backyard Gardening Program). The City of Phoenix also shared these indicators with the C40 cities (global network of mayors taking climate action) and CDP-ICLEI Track (climate reporting platform and progress tracker for cities).
Expanding Indicators for State-Level Decision-Making in North Carolina
Under ongoing projects, we are expanding this work for applications at the state level. For example, we selected, developed, and mapped indicators for the state of North Carolina, which has historical experience with severe flooding from events such as Hurricanes Matthew, Floyd, and now Helene. This was done in close partnership with the North Carolina Department of Environmental Quality (NCDEQ), and they are now applying our indicators as part of their criteria to prioritize disadvantaged and under-resourced areas for Brownfields redevelopment. Through a community meeting organized by NCDEQ, the indicators were shared with the Lumber River Council of Governments (LRCOG), which plans to apply these indicators for decision-making in their region. NCDEQ and Region 4 plan to share the indicators with other partner state agencies and programs.
Creating National-Level Screening Tools for Vulnerable Sites
At the national level, we are currently developing indicator data layers to screen for sites/waste facilities that may be vulnerable. In the future, we plan to assess cumulative impacts and climate vulnerability for prioritizing assistance to communities and enhancing equitable resilience.
Relevance to Global Contexts
We developed the indicators approach with U.S.-based partners, but our approach is applicable and relevant for other parts of the world where sites/waste facilities are located close to densely populated and under-resourced urban areas. This approach can also be applied to assess the vulnerability of communities near the estimated 2.8 million sites in the European Union where polluting activities have occurred or are taking place.
To improve their relevance to other countries, the indicators can be adapted to consider type of extreme event scenarios, sites/waste facilities, hydrological or wind patterns, and population sensitivities. They can also be adjusted to reflect the available data, especially in data-poor countries.
- EPA Office of Research and Development