Insights


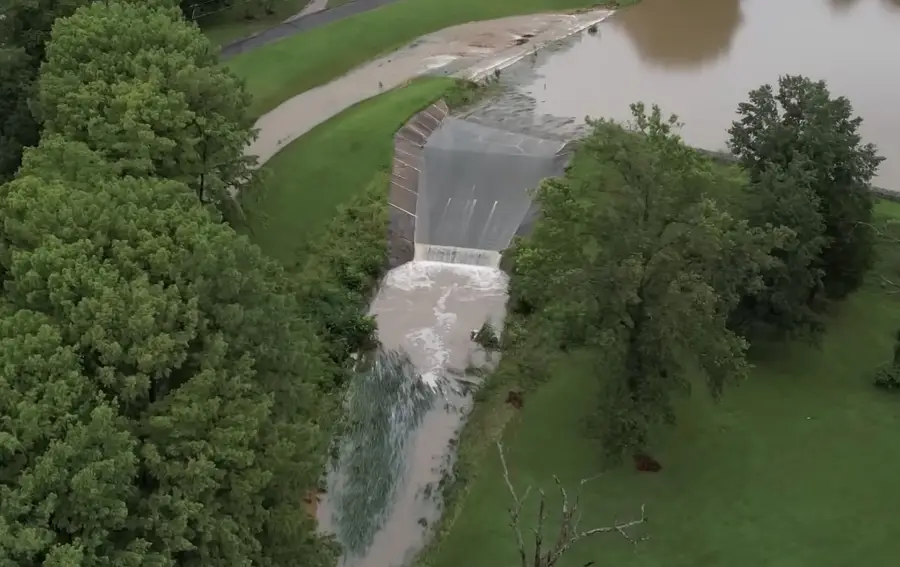
Drone footage from KSDK News (https://www.youtube.com/watch?v=bbfYMIMr5Vo)
Another week and yet another extreme flooding event across the U.S., now in Nashville, Illinois on July 16, 2024. Nashville, Illinois; Manawa, Wisconsin; Rapidan Dam, Minnesota - three dams, three weeks. Although there was extreme flooding, property damage, and evacuations from this event, fortunately there have been no reported loss of lives and the dam appears to be intact without breach, even though it has reportedly overtopped.
In our ‘Hydrology In The News’ series, Jonathan Quebbeman will recap and analyze recent hydrologic extremes. The following is a brief review and commentary on the Nashville, Illinois event.
Precipitation Estimates
NOAA's blended precipitation products indicates a 6-hour maximum of 6.5 inches averaged across the watershed, which is between a 200- and 500-year event based on NOAA's Atlas-14 precipitation point frequency for this region. For the 3-hour block, it shows 4.3 inches of precipitation, which is approximately a 100-year return period. These estimates result in a spatially distributed (gridded) precipitation product, although knowing exactly what happened across the watershed is challenging.
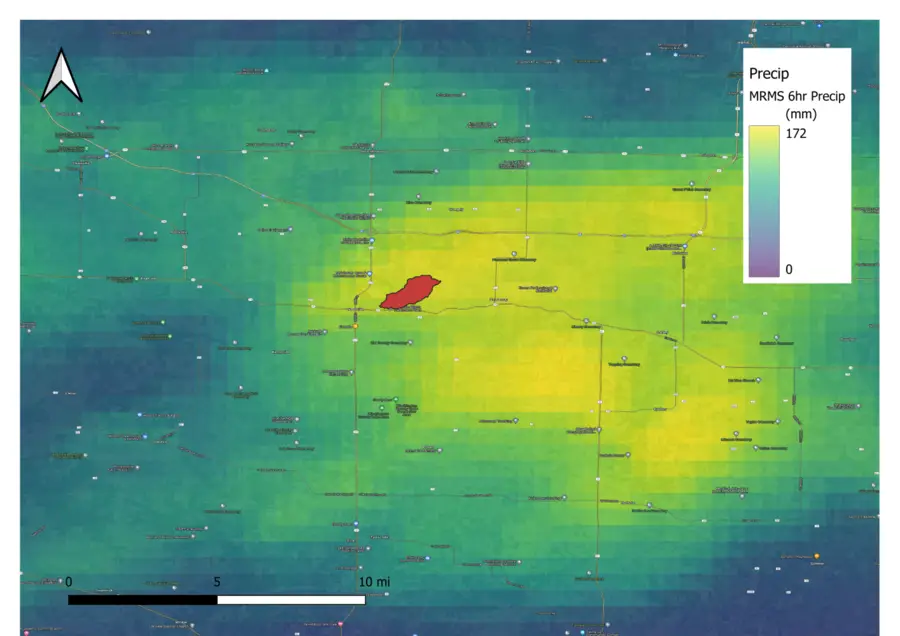
6-hour precipitation totals with watershed of Nashville City Reservoir dam
A local weather gage east of the watershed, but with similar precipitation totals for various durations, shows even higher estimates of intensity with a maximum of 5.73" in a 2-hour block (5:30 to 7:30am), which is beyond 1000-year event, according to NOAA's Atlas-14 point precipitation frequency estimates. Regardless if referencing radar products, or nearby ground observations, this was a rare and extreme precipitation event.
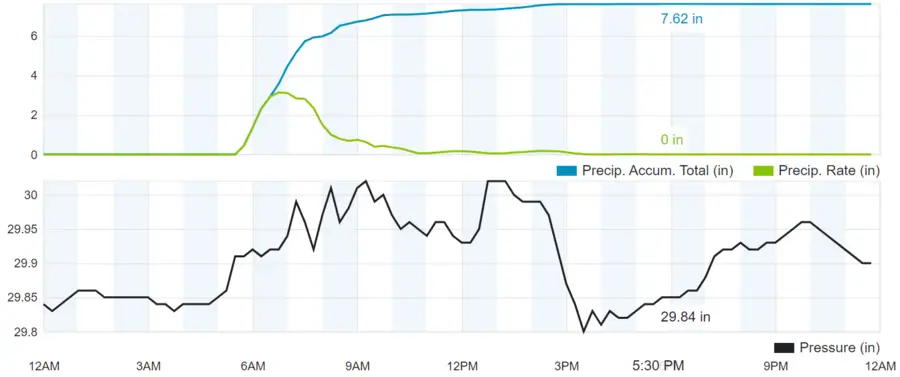
Precipitation at nearby McCoy Farm Station, KILRICHV5 (https://www.wunderground.com)
Estimated Inflow and Spillway Capacity
Using nearby weather station data to represent the precipitation hyetograph (distribution of precipitation over time) for the Nashville City Dam watershed, this could result in a peak inflow of approximately 9,000 cfs using reasonable assumptions above the 1.4 sq. mile drainage area.
According to the National Inventory of Dams (NID), the dam has a 180 foot wide uncontrolled (non-gated) spillway section, which verifies from aerial imagery. Based on local Lidar data, it also appears to have 4.5 feet of operating range before overtopping of the earthen dam would begin. Again, using best estimate assumptions, this would be a peak spillway capacity of approximately 5500 cfs - less than the estimated inflow of 9000 cfs, thus quickly overwhelming the reservoir storage and spillway leading to overtopping (the NID reports a peak capacity of 9710 cfs, although this value may be over-estimated).
Considerations
Fortunately, it appears both the depth and duration of overtopping were not sufficient to result in a breach of the dam, which could have resulted in greater damage downstream, loss of a water supply reservoir, and even further potential for loss of life.
Small dams on relatively small watersheds, such as the Nashville City Reservoir, are susceptible to intense localized precipitation with very little warning time before flows increase. Forecasting precipitation at small scales is challenging, and warning times for response are short. Although such a dam has been designed to handle an extreme flood, the frequency and magnitude of these extremes is likely to increase with our changing climate resulting in more similar events. Understanding these flood loadings, and how they're changing, is key to supporting our important infrastructure and helping to protect lives.
Learn more about our Center for Water Resources and risk assessment services.
Disclaimer: This piece was written by Jonathan Quebbeman (Director, Water Resources) to share perspectives on a topic of interest. Expression of opinions within are those of the author or authors.