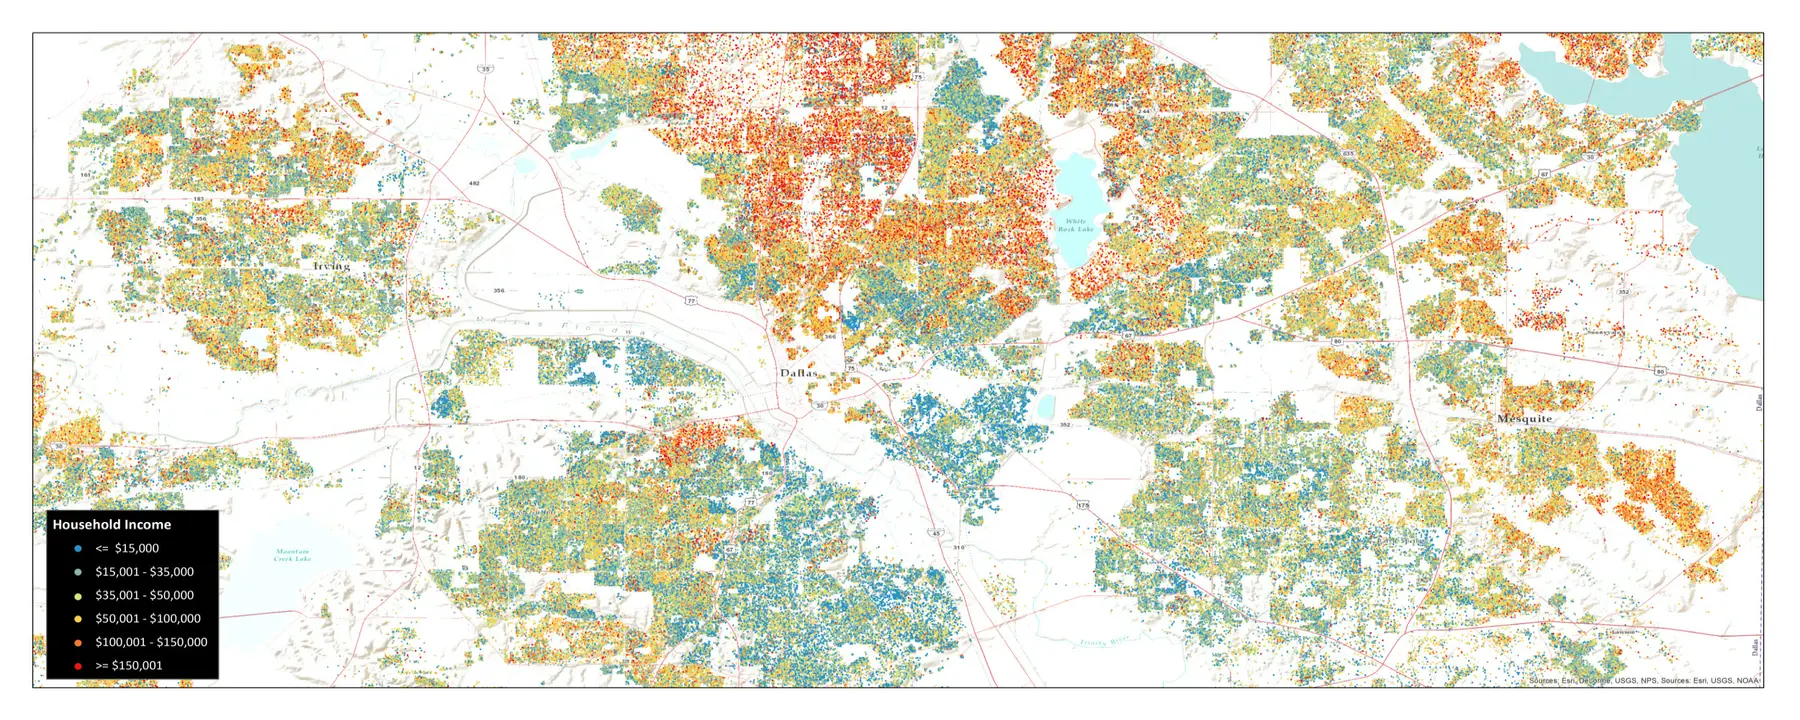
Providing accurate representation of the complete household and person population throughout the United States
Sociodemographic data are typically aggregated to what are called administrative units, such as census tracts, ZIP codes, or census block groups. But what if that data could be drilled down to represent the entire population of the United States at the household or even person level? A tool with that capability would allow users to examine subtle shifts in income or intricate patterns of race, age, household size, and income for any location in the United States.
This information could be used to plan for emergency response, assess environmental exposures, simulate infectious disease transmission, calculate the effects of public health interventions, or optimize the distribution of resources across space.
The RTI U.S. Synthetic Household Population™ provides an accurate representation of the complete household and person population throughout the United States. The database includes locations and descriptive sociodemographic attributes derived from completely public data sources. It statistically matches the real household population and contains no personally identifiable information.
Creating a Dot for Every Person and Every Home
Unlike typical sociodemographic data, the RTI U.S. Synthetic Household Population represents households and persons as dots on a map—matching high-resolution population distributions with the correct mix of households in each census block group.
This simple data structure enables powerful clustering, optimization, and spatial statistical analysis without sacrificing any accuracy. In some ways, the database is more accurate than census data because the distribution of households varies within census block group boundaries. In contrast, typical sociodemographic maps presume that households are evenly distributed within each boundary. To protect privacy, the interactive map does not show actual households in their exact locations.
The RTI U.S. Synthetic Household Population features 116,000,000 records to represent each household and 300,000,000 records to represent each person living in those households. It includes attributes such as age, sex, race, income, and educational attainment for each person, as well as the size, income, householder race, and householder age for each household.
There are also representations by age and gender for persons who live in group quarters such as nursing homes, college dorms, prisons, and military barracks.
The database includes an estimated location of workplaces for each working adult and estimated location of schools for each student attending primary or secondary school.
An Open-Source Tool with Limitless Research Potential
The RTI U.S. Synthetic Household Population was originally developed to support the Modeling of Infectious Disease Agents Study, funded by the National Institutes of Health. The study established models to study the spread of infectious diseases through social contact. For example, the database and disease models were used to study the spread of seasonal illnesses within the state of North Carolina.
Health agencies can use the tool to track the spread of infectious disease. Roadway and transit engineers might use it to understand how transportation networks are used, and urban planners can study how people make choices about where to live. The database could also help logistics professionals examine how best to optimize supply chain operations.
Users can integrate, enrich, and extend other datasets by linking them to the RTI U.S. Synthetic Population. For example, users can integrate household survey data from state and federal agencies to add new characteristics and behaviors to synthetic persons or households. Such data can be linked by location or by statistical matching methods.
Practical Application: The Neighborhood Map of U.S. Obesity
Using the methods described here, we developed an example dataset called the Neighborhood Map of U.S. Obesity.
This detailed map of obesity has far higher resolution than any previously available national-level data, showing community level information such as the percent of the adult population that is obese, the difference in the percent of population that is obese as compared to the national average, and the statistically significant clusters of obesity. By providing an accurate view of obesity at the community level, the Neighborhood Map of U.S. Obesity allows users to locate the most at-risk populations and better target outreach, interventions, and community health activities in these areas.
RTI’s Neighborhood Map of U.S. Obesity was named a U.S. Obesity Data Challenge winner in 2015.
Learn about RTI's synthetic population data tool SynthPop.
- National Institutes of Health (NIH)

