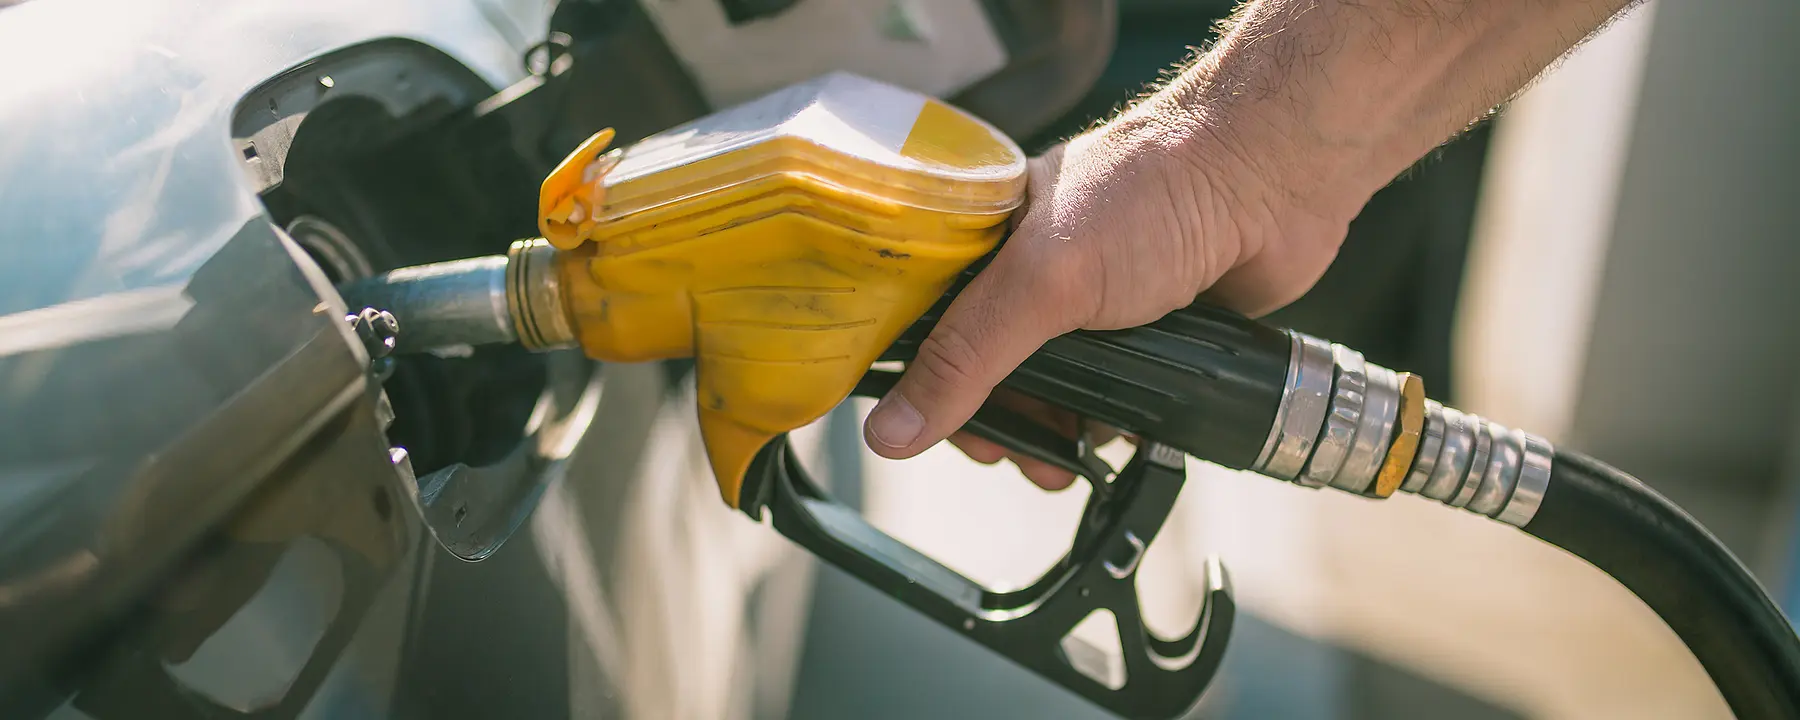
Helping to assess the weekly cost of a gallon of gasoline
Every Monday afternoon, the U.S. Energy Information Administration (EIA) updates its webpage (https://www.eia.gov/petroleum/gasdiesel/) listing average motor gasoline and on-highway diesel prices across the United States. At a glance, economists, politicians, and anyone with an internet connection can see not only how much a gallon of gas costs at the pump, but how much that price has changed over the previous week and the previous year. Users can also see variations in price by region: for example, during the week of February 5, 2018, regular gasoline cost 50 cents per gallon more on the West Coast than almost anywhere else in the country.
While many people are familiar with EIA’s weekly gas price index, few are aware that, since November 2017, RTI International has been collecting the raw data used in this report. This involves contacting more than 1,200 filling stations across the country (including a combination of retail gas stations and on-highway diesel vendors) and obtaining a snapshot of gas and diesel prices across five regions: East Coast, West Coast, Gulf Coast, Rocky Mountains, and the Midwest. Here’s how the process works, step by step:
- Before we start the data-collection process, EIA provides a forecasted price change for the stations. This sets an expected baseline for gas prices, so we can flag any reporting gas stations with higher- or lower-than-expected prices. Since this survey is protected by the Confidential Information Protection and Statistical Efficiency Act (CIPSEA), multiple restrictions and protections are used to protect the confidentiality of information gathered.
- The current sample of more than 800 gas stations, which has persisted for several years, was selected to include major national fuel retailers, small chains, and independent owners. The current diesel sample includes more than 400 truck stops and service stations.
- Each Monday morning, a team of approximately 30 employees at our Research Operations Center in Raleigh, North Carolina, begins calling the managers of gas stations on our list. Data collection is multimodal, which means that we’re also equipped to receive gas prices via online submission, emails, fax, updated webpages, or text messages.
- At the conclusion of the data-collection process (at 12:45 p.m. EST for diesel and 1:15 p.m. EST for regular gasoline), the prices obtained are sorted across more than 40 data sets and subjected to multiple levels of computerized analysis and quality control.
At the end of this process, EIA validates and posts the results on its website, broken out by region and selected states/cities. With the assistance of our tightly coordinated data-collection efforts, EIA performs a valuable service for motorists—helping them to determine how much it will cost to drive from Chicago to Miami, or to commute to and from work over the course of a given week.
Soon, we will be expanding our efforts beyond data collection: EIA has engaged us for a major update of the existing gasoline sample group, meaning that the current sample of retail gas stations will be retired (with thanks) and a new sample of 1,000 recruited in its place. In the future, we hope to expand our data-collection and reporting capabilities, so we can continue to supply EIA with reliable information about gasoline prices for the foreseeable future.
- U.S. Energy Information Administration
